What students learn
1. Useful isn't enough
People can believe an app is useful and still drop it. TAM separates perceived usefulness from perceived ease of use (Davis, 1989).
2. Diagnose before you promote
Downloads are a vanity number when weekly use is under 8%. More promotion pours people into the same leaky first use.
3. Attitude follows experience
‘Good idea, annoying app’ is a mixed attitude: fix the effort and show it, rather than paying for praise.
4. Fix in the right order
Ease of use first, then coverage, then promotion, and measure weekly active users, not downloads.
Pick a format
Seminar warm-up
Students play solo for 10 minutes, then you debrief the rows that split the room. The plan below.
Assessment preparation
Set it before students write the analysis section of a report: the end screen shows a model criterion, rating, evidence, so what table.
Homework or revision
Share the link. It works on a phone and keeps progress if the page is reloaded.
Whole class on one screen
No devices? Put it on the projector, read each item aloud, take a show of hands and click the room's answer.
Cuplet
Cuplet is an app for borrowing reusable cups in Northbridge, a made-up city. Scan a cup at a café, return it at any partner café, and get 20p off your drink. Three months after launch, lots of people have downloaded it, but hardly anyone uses it. The founders ask you why.
| Step | What students do | Points |
|---|---|---|
| 1 | Rate the criterion: strong, moderate, weak or not at all. | 2 if exact, 1 if one step away |
| 2 | Pick the piece of evidence that best supports the rating. | 2 for the best, 1 for a supporting piece |
| 3 | Choose the so what: what the campaign should do about it. | 2 |
The evidence board (7 pieces, all invented)
| Card | Source | What it says |
|---|---|---|
| E1 | App store review, 5 stars | “Love not needing a throwaway cup, and the 20p off adds up.” |
| E2 | Usability test notes (5 users) | 4 of 5 couldn't find where to scan the cup. Sign-up asks for 9 fields and email verification before you can borrow anything. |
| E3 | User survey (220 replies) | 71% agree “Cuplet would be useful to me”. 23% agree “Cuplet is easy to use”. |
| E4 | Café staff note | “Customers like the idea, but they give up at the counter while the queue waits behind them.” |
| E5 | Social media comments | “Good idea, annoying app 😩” · “Would use it if it was quicker” · “Love what they're trying to do” |
| E6 | App analytics | 4,100 downloads → 1,050 accounts created → 310 active users a week. |
| E7 | Café map | 6 of the city's 40 cafés take Cuplet cups at the moment. |
Answer key
Collapsed, so students skimming this page don't meet the answers by accident. Each criterion is worth 6 points; 21 or more earns the second badge.
Show the answer key
| Criterion | Rating | Best evidence | So what |
|---|---|---|---|
| Perceived usefulness | strong Most people see the point: 71% say it would be useful, and users value both the waste saving and the 20p off. Usefulness isn't the problem. | E3 (User survey (220 replies)) Also accepted (1 point): E1 | ✓ Keep the benefit message (less waste, 20p off): usefulness isn't what's holding people back. ✗ Add loyalty points and a carbon tracker to make it more useful. More features can make an app harder to use, and ease of use is the real problem here. ✗ Rethink what the app is for. The purpose is valued. Changing it throws away the strength. |
| Perceived ease of use | weak Only 23% find it easy, most testers couldn't find the scan button, and nine sign-up fields stand between a new user and their first cup. | E2 (Usability test notes (5 users)) Also accepted (1 point): E3, E4 | ✓ Let people scan first and sign up later, and make the scan button the first thing they see. ✗ Make a tutorial video explaining the nine sign-up steps. Explaining a hard process is better than nothing, but it's still a hard process. ✗ Run more ads to bring in new users. New users will hit the same wall. Fix ease of use first. |
| Attitude towards using | moderate People like the idea but are frustrated by the app: ‘good idea, annoying app’ sums it up. Mixed, as you'd expect when usefulness is high and ease of use is low. | E5 (Social media comments) Also accepted (1 point): E4 | ✓ Once it's fixed, show it's now quick: a 10-second scan demo at the counter and in short videos. ✗ Pay influencers to say how much they love the current app. Positive posts won't survive a frustrating first try, and undisclosed paid praise breaks advertising rules. ✗ Ignore attitude: only behaviour matters. In TAM, attitude links beliefs to intention. It's a useful early warning. |
| Intention and actual use | weak Out of 4,100 downloads, only 310 people use it each week (under 8%). Interest turns into very little actual use, and only 6 of 40 cafés take the cups. | E6 (App analytics) Also accepted (1 point): E7 | ✓ Fix ease of use first, then sign up more cafés, then promote, and track weekly active users, not downloads. ✗ Push for more downloads with a big launch campaign. Most downloads already fail to turn into use, so more would just pour into a leaky funnel. ✗ Give everyone £1 off to force adoption. Bigger discounts raise usefulness, which is already strong, and it's costly. The barrier is effort. |
The one that splits the room: Attitude (moderate): high usefulness and low ease of use give a mixed feeling, not a bad one.
How long will it take?
Every time in this guide is a range. The low end is a tight run; the top end is what most classes take once students discuss, decide and react to the results.
In class: 15 to 30 minutesSolo: 8 to 12 minutes
What moves you up or down the range
- When you call time. Students play at their own pace. Moving to the debrief once most have finished keeps you near the low end; waiting for everyone moves you to the top.
- Reading the evidence and explanations. Students who read every card and every explanation, as they should, take longer than those who click through.
- Phones joining or loading. Sharing the link or QR code, and patchy Wi-Fi.
- Interaction in between. Pairs comparing ratings, questions, or arguing about a borderline row.
- The debrief. One contested row, or every row plus the step to your students' own client.
- Your group. Familiarity with the framework, reading in a second language, and the room layout.
Short on time? Call time when most have finished and debrief one row. Want the richest discussion? Run it in pairs and plan for the top of the range.
Step by step
15 to 30 minutes, with students on their own phones or laptops, alone or in pairs.
0 Set it up
2 to 4 min- Say
- “Four criteria. For each one: rate it, prove it with the strongest evidence, then say what it means for the campaign. That last step is where the marks are.”
1 Play
8 to 15 min- Students
- Read the brief and skim the evidence board.
- Work through the four criteria: rating, evidence, so what.
- Read the explanation after every answer.
- Watch for
- Students picking the organisation's own claims as evidence instead of measured or customer evidence.
- Students choosing a so what that fixes something that's already strong.
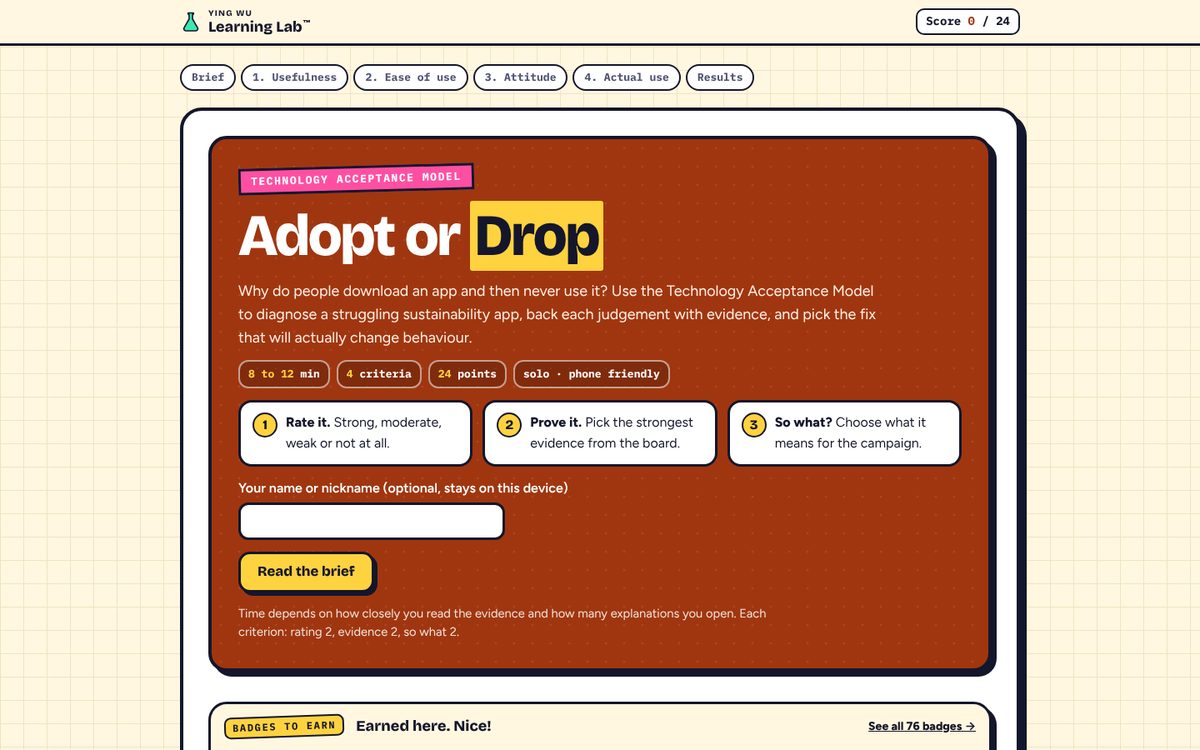
The start screen: rate it, prove it, so what. 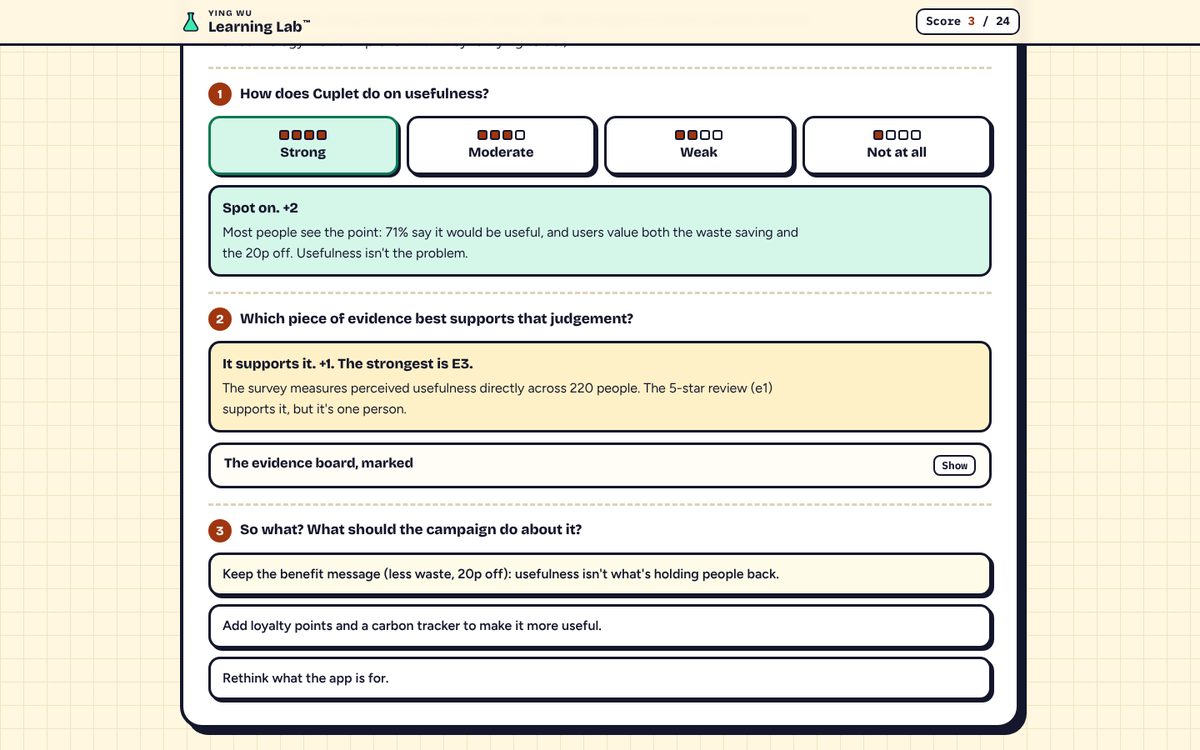
Each answer is explained straight away. 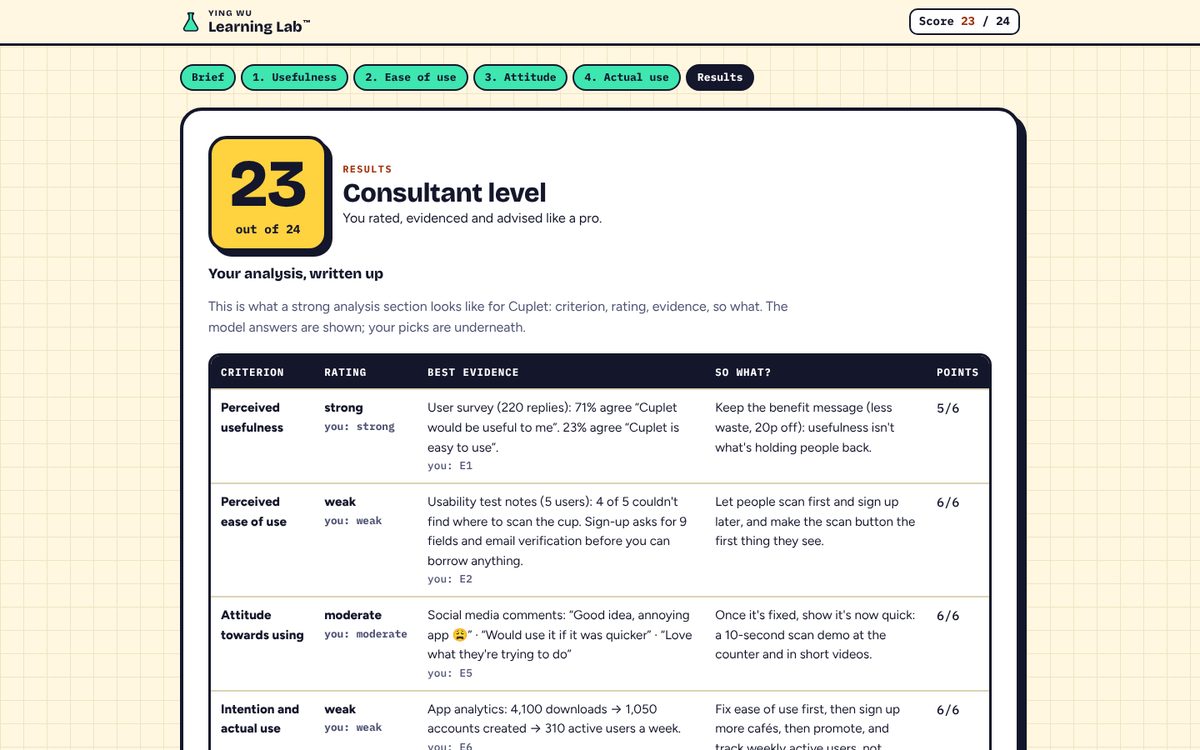
The end screen: a model analysis table to copy. 2 Debrief
3 to 8 min- Ask
- “Which rating did you disagree with? What evidence would change it?”
- “Which so what would you put first in the campaign, and why?”
3 Apply it
2 to 5 min- Say
- “Now do one row for your own client: criterion, rating, one dated piece of evidence, so what.”
Linking it to a report
- The end screen shows a model analysis table: criterion, rating, best evidence, so what. Students can copy it as text as a template for their own work.
- Use the framework as one core framework, with its criteria as subheadings, and the four-point scale (strong, moderate, weak, not at all) for each one.
- The case is fictional on purpose, so nobody gets the answers for a real client. Students apply the method, not the answers.
If something goes wrong
| Problem | What to do |
|---|---|
| A student reloaded the page | Progress is kept in that browser tab. Closing the tab starts again from the beginning. |
| “Copy the table” does not copy | Some browsers block the clipboard. Students can select the table on screen and copy it by hand. |
| No devices | Put the game on the projector and play it as a whole class: show of hands for each step, then click the room's answer. |
| A student argues for a different rating | Good. Ask what evidence would justify it. Close ratings (one step away) still earn a point. |
Cheat card
- Share the link or QR code
- “Rate it, prove it, so what?”
- 8 to 15 minutes of play
- Attitude (moderate): high usefulness and low ease of use give a mixed feeling, not a bad one.
- Debrief one contested row
- One row for their own client
Behind the game
- Davis, F.D. (1989) ‘Perceived usefulness, perceived ease of use, and user acceptance of information technology’, MIS Quarterly, 13(3), pp. 319–340. doi:10.2307/249008.
- Davis, F.D., Bagozzi, R.P. and Warshaw, P.R. (1989) ‘User acceptance of computer technology: a comparison of two theoretical models’, Management Science, 35(8), pp. 982–1003. doi:10.1287/mnsc.35.8.982.
Cuplet, Northbridge and all the evidence are invented for this game. Any resemblance to a real app is coincidental.